Here we compare the code generated by the gcc
compiler, icc
compiler and dco
optimized code generated by the gcc
compiler. See Results. Jump
to Conclusions.
To generate executables we used:
- gcc version
4.1.2 C compiler with the following compiler options:
-O3 -fomit-frame-pointer -funroll-all-loops -ffast-math -march=pentium4
-mfpmath=sse -msse2 -mstackrealign
- Intel's icc
version 9.0 C compiler with the following compiler options:
-O3 -xN -tpp7 -ipo
- dco version 1.0.2
for
every
benchmark, dco
was invoked twice: first without any
options ( default mode ) and then with the -no-packing option;
the
best execution time is reported - note that the x86
assembly source that was optimized
is one generated by gcc as describe above
We
used the C version of the Livermore loops benchmark. The code was
modified to eliminate calibration, thus ensuring that on every run the
same number of iterations are executed on the same input data. This
makes it possible to compare the execution times of the program ( and
not the estimate amount of MFlops as in the original implementation ).
As we are comparing the quality of the generated code and not the
quality
of the library routines, the kernel 22, testing the performance of a library
function, was removed
from the study.
All
benchmarks were executed under Fedora
Linux operating system
running on the 2.8GHz Pentium4 computer with 512MB RAM installed. It
was ensured that benchmarks run under the same conditions on the system
with the minimal possible
load.
Every benchmark was executed 3 times with the time reported being
neither the best nor the worst.
The following table presents collected execution data. Jump
to Conclusions.
The columns under gcc, gcc+dco
and icc
headers present execution times
( in seconds ) achieved by the gcc generated code, dco
optimized code
and icc generated code respectively. The column
under the gcc+dco/gcc
header lists the improvements achieved by utilizing dco over the gcc generated
code. The column under the icc/gcc
shows how much faster is icc generated code than gcc generated
code ( or slower if the number
is negative ). The column under the icc/gcc+dco
shows how much faster is icc generated code than dco
optimized code ( or slower if the number is negative ).
The best results are shown in this
color ( considering the results with the difference falling in the
range from -5% to 5% to be "the same" ).
| Kernel# |
gcc
|
gcc+dco |
icc |
gcc+dco/ |
icc/ |
icc/ |
|
|
|
|
gcc |
gcc |
gcc+dco |
| 1 |
4.97 |
3 |
2.96 |
39.64% |
40.44% |
1.33% |
| 2 |
2.38 |
2.34 |
2.28 |
1.68% |
4.20% |
2.56% |
| 3 |
5.93 |
2.33 |
2.54 |
60.71% |
57.17% |
-9.01% |
| 4 |
4.66 |
3.79 |
4.63 |
18.67% |
0.64% |
-22.16% |
| 5 |
5.2 |
1.75 |
2.38 |
66.35% |
54.23% |
-36.0% |
| 6 |
4.53 |
3.55 |
3.87 |
21.63% |
14.57% |
-9.01% |
| 7 |
4.87 |
3.12 |
2.57 |
35.93% |
47.23% |
17.63% |
| 8 |
5 |
3.87 |
3.25 |
22.60% |
35.00% |
16.02% |
| 9 |
4.6 |
3.86 |
4.97 |
16.09% |
-8.04% |
-28.76% |
| 10 |
4.94 |
3.38 |
4.32 |
31.58% |
12.55% |
-27.81% |
| 11 |
5.78 |
0.93 |
1.65 |
83.91% |
71.45% |
-77.42% |
| 12 |
5.18 |
4.42 |
4.13 |
14.67% |
20.27% |
6.56% |
| 13 |
4.57 |
4.62 |
4.61 |
-1.09% |
-0.88% |
0.22% |
| 14 |
4.71 |
4.12 |
2.3 |
12.53% |
51.17% |
44.17% |
| 15 |
3.72 |
3.73 |
3.67 |
-0.27% |
1.34% |
1.61% |
| 16 |
5.61 |
5.32 |
5.66 |
5.17% |
-0.89% |
-6.39% |
| 17 |
5.01 |
4.98 |
4.86 |
0.60% |
2.99% |
2.41% |
| 18 |
4.7 |
3.74 |
3.45 |
20.43% |
26.6% |
7.75% |
| 19 |
5.81 |
4.1 |
6.77 |
29.43% |
-16.52% |
-65.12% |
| 20 |
4.53 |
4.43 |
4.38 |
2.21% |
3.31% |
1.13% |
| 21 |
4.88 |
4.6 |
1.05 |
5.74% |
78.48% |
77.17% |
| 23 |
4.17 |
3.85 |
4.67 |
7.67% |
-11.99% |
-21.3% |
| 24 |
4.85 |
0.78 |
1.66 |
83.92% |
65.77% |
-112.82% |
| Geometric
Mean |
4.74 |
3.21 |
3.29 |
32.33% |
30.56% |
-2.61% |
icc generated code is, on average, 3% slower than dco optimized code and 31%
faster than gcc
generated code. dco
optimized code is, on average, 32%
faster than gcc generated code (
see this
for the results of a slightly different study ).
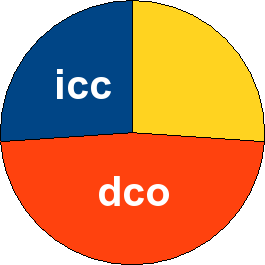
In 6 ( out of 23 ) cases icc
generated faster code, in 11 cases dco
generated code was faster and in 6 cases icc
and dco generated code
of the same complexity:
